
Why Instagram Analytics Tools Disagree
The failure nobody explains
You open your analytics tool. It says the account reached 12,400 accounts last week. You open the Instagram app, tap Insights, and it says something else. Neither number moves when you refresh. Both tools are pulling from Meta. One of them, obviously, is wrong.
Almost certainly neither is. Most guides on Instagram analytics are about reading the numbers: what reach means, what a good engagement rate is, which charts to look at. Useful, and none of it explains the thing you are actually staring at. What you are staring at is the gap between the Instagram app, which reads Meta's internal data directly, and the public Instagram Insights API, which is a smaller, older, partly-deprecated surface with holes in it that every third-party tool has to paper over on its own.
Those holes are real, they are documented, and the choices tools make about them are almost never disclosed. We build Instagram analytics and reporting at Socioverse against Meta's Graph API v24.0, which means we have made every one of those choices deliberately. This is what the API actually returns, why the numbers legitimately differ, and how to tell a real discrepancy from an artefact.
First principle: there is no "Instagram analytics" endpoint
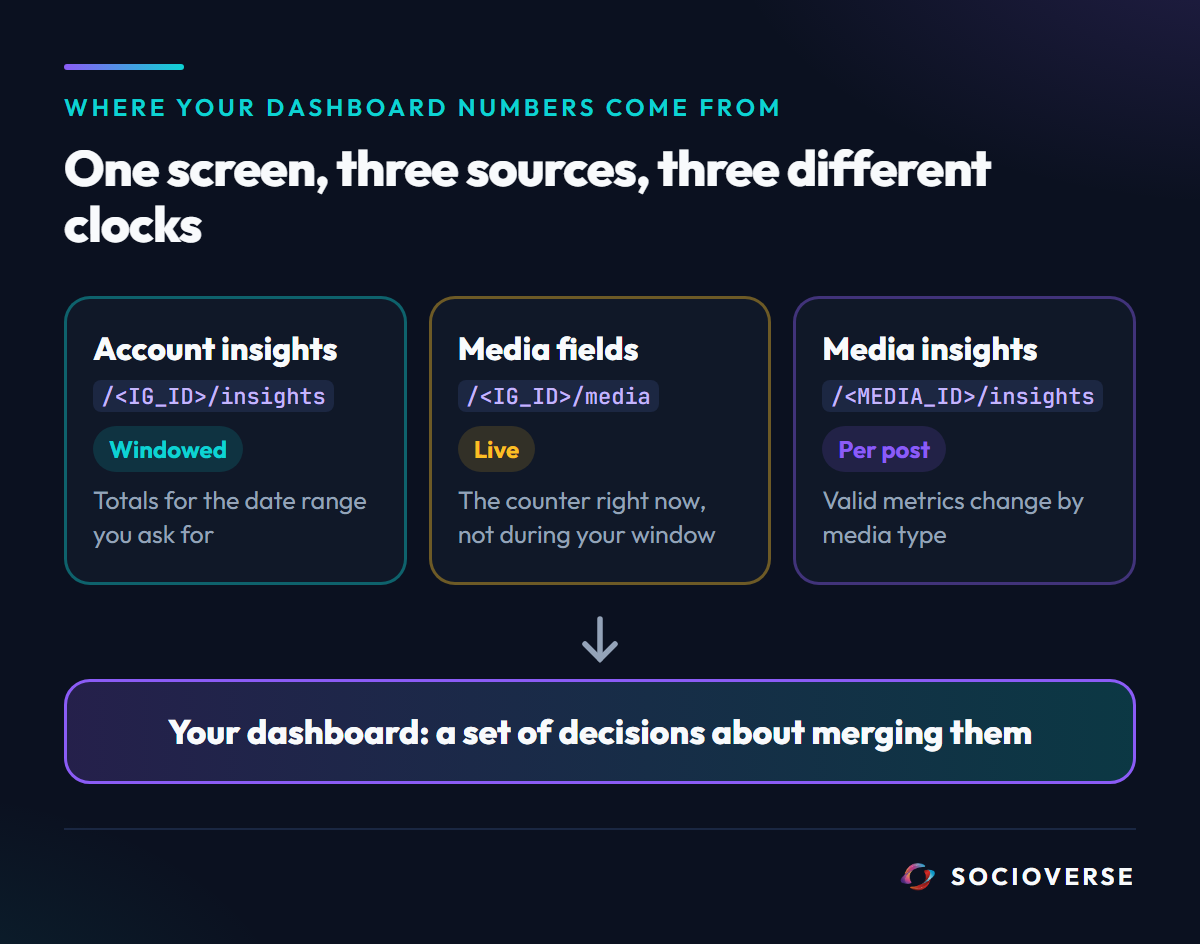
There is no single call that returns your dashboard. A third-party analytics view is stitched from at least three sources that behave differently:
| Source | What it gives | How it behaves |
|---|---|---|
Account insights (/<IG_ID>/insights) |
Reach, accounts engaged, likes, comments, shares, saves, replies, profile link taps | Windowed. You ask for a date range and get totals or a time series for that range. |
Media object fields (/<IG_ID>/media) |
like_count, comments_count, caption, permalink, timestamp |
Live counters. Always the value right now, not the value during your window. |
Media insights (/<MEDIA_ID>/insights) |
Reach, views, shares, saves per post | Per-post, and the valid metric list changes by media type. |
A dashboard is a set of decisions about how to merge three sources with different time semantics into one screen. That is where most of the disagreement is born, and it happens before anyone gets a number wrong.
1. Impressions does not exist anymore, and Views is not its replacement
This is the single biggest cause of a number that looks broken.
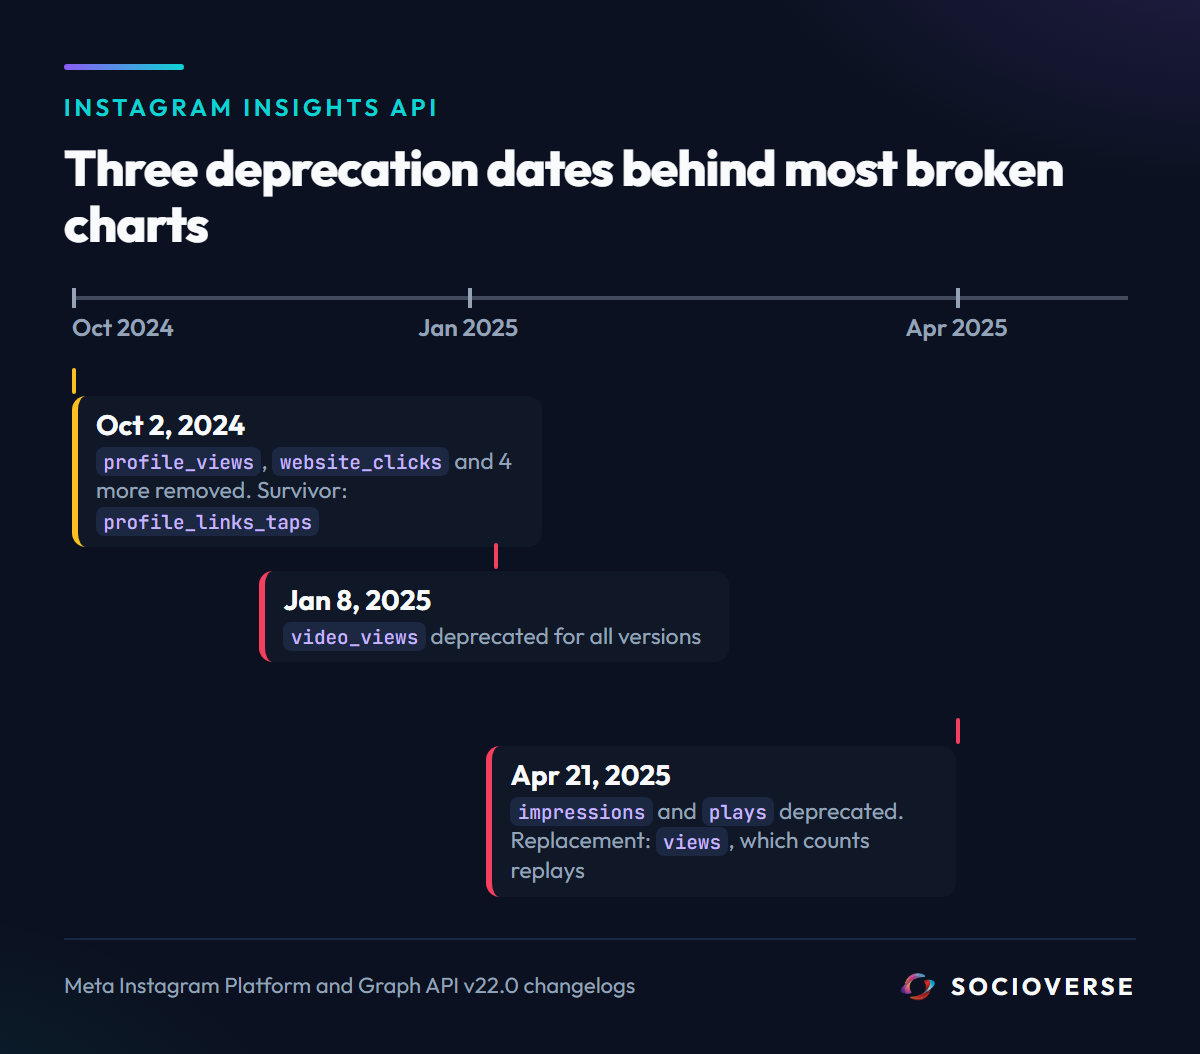
There were two deprecation waves, not one, and conflating them is how tools end up with a chart nobody can explain.
| Metric | Deprecated for | All versions from |
|---|---|---|
video_views |
v21.0+ | January 8, 2025 |
impressions |
v22.0+ | April 21, 2025 |
plays |
v22.0+ | April 21, 2025 |
The replacement metric for all three is views. Note the four-month gap: a tool that patched the April wave and never revisited January had video_views returning nothing for three and a half months first.
views is not a rename. It counts differently:
- Impressions counted the number of times content was displayed.
- Views counts plays and replays of a Reel, and displays of a feed post, carousel or story.
For a Reel that people loop, views is structurally higher than the old impressions number for the same content. So a tool that quietly aliased its old "Impressions" column to views after the deprecation shows a jump in April 2025 that never happened in reality. A tool that kept requesting impressions shows zeroes, or an error it swallowed.
Our implementation requests views explicitly for both Reels and feed posts, and normalises the legacy metric names Meta still emits in some shapes (video_views and ig_reels_aggregated_all_plays_count) onto consistent fields rather than letting two names for the same thing land in the same chart.
If your historical chart has a step change in April 2025, that is this. It is a metric definition change, not a growth event.
2. "Profile views" is measuring something narrower than it used to
This one is older than the impressions change, and that is exactly why it catches people out. On October 2, 2024, Meta deprecated a whole block of profile-action metrics at once: profile_views, website_clicks, email_contacts, phone_call_clicks, text_message_clicks and get_direction_clicks. The surviving metric on the Instagram API with Instagram Login is profile_links_taps.
Read the names carefully, because they are not equivalent. The old set counted views of your profile and clicks on your website link as separable things. profile_links_taps collapses every tap on every link in your profile into one number. A tool that maps profile_links_taps into a KPI card still labelled "Profile Views" is showing you a link-tap count under a profile-view label, and those differ by an order of magnitude on most accounts.
The confusion is compounded by the Instagram app itself, which still shows you something called profile views in its own Insights tab. That number comes from Meta's internal data, not from this API, and there is no endpoint that returns it. If your dashboard and the app disagree on profile views, this is why, and no third-party tool can close that gap.
This is the failure mode that makes people think their reach collapsed. It did not. The card was relabelled underneath them.
3. Your follower growth chart is your tool's memory, not Instagram's
This one surprises people, and it is the most important thing in this article for anyone choosing a tool.
The Instagram API does not give you your follower history. You can ask what your follower count is now. There is no endpoint that answers what it was on the second Tuesday of last month. Meta's audience metrics are gated and current-state; the historical series simply is not on offer.
So every 30-day follower growth chart you have ever seen in a third-party tool was built the only way it can be: the tool recorded your follower count itself, once a day, every day, and drew a line through its own records.
The consequences are worth stating plainly, because no vendor puts them on the pricing page:
- Your growth chart starts the day you connected the account. Not the day you created it. If the chart looks empty, it is not broken, it is young.
- If the tool was down for three days, the chart has a three-day hole, and the shape of your growth is now partly a story about that tool's uptime.
- Two tools will disagree about the same week if they snapshot at different hours, because they are sampling a moving number at different points.
Socioverse runs a daily snapshot job that writes one row per account per day into a follower_snapshots table, keyed on account and date so a re-run can never double-count a day. The 30-day growth chart and the week-over-week delta in the weekly report both read from that table. It is our record, honestly labelled as a record, and it is the only way this chart can exist for anyone.
When two tools disagree about your follower growth, neither is reading a Meta number. They are comparing their own diaries.
4. Demographics are gated, and the gate looks like an error
Audience breakdowns are not always available. Meta enforces minimum thresholds before it will return them, to protect the privacy of small audiences:
| Metric | Requirement |
|---|---|
follower_demographics (city, country, age, gender) |
100+ followers |
engaged_audience_demographics |
100+ engaged accounts |
Here the documentation and the API disagree, and it is worth being precise about which you build against.
Meta's reference page says only that the metric is "not returned" below the threshold, which reads like you should expect an empty result. In production it comes back as a Graph API error object with a code in the 1/10/100 family. We know because our handler branches on exactly those codes, and it branches on them because we watched them arrive.
That distinction matters more than it sounds. An error and an absence look identical to a badly built dashboard, so the honest message ("you need 100 followers for this chart") gets replaced by a spinner that never resolves or a generic failure toast. If you are building against this, code for the error, not for the empty array the docs imply.
Socioverse treats the documented threshold errors as an expected state rather than a fault: the demographics panel degrades to an explanation instead of an error, and the rest of the page renders normally. Where follower demographics are unavailable, the city and country panels fall back to engaged-audience demographics rather than going blank.
The receipt that is genuinely ours
There is a version of handling this that looks correct and is not, and we shipped it.
Our first implementation logged those threshold errors with console.error. Functionally fine, the dashboard behaved correctly, users saw the right thing. But every single insights call for every account under 100 followers wrote an ERROR line into the logs. On a platform with a lot of new accounts, which is exactly what a young product has, the error stream became almost entirely composed of a condition that is not an error. Real failures, the ones that actually needed a human, were sitting in that stream and were effectively invisible.
The fix was to classify: known threshold error codes log at info level with the reason attached, anything else escalates to a real error. Nothing a user could see changed at all.
The general lesson is one worth stealing if you are building on any third-party API: an expected negative response is not an error, and logging it like one destroys the signal value of your error stream. You do not notice the cost while you are writing it. You notice it during an incident, when you cannot find the real line.
5. The same dashboard can disagree with itself, legitimately
Look again at the table in the first section. Media insights are windowed. like_count on the media object is live.
So the like count on a post card and the likes total in a weekly summary are answering different questions. The card says how many likes this post has right now, including the ones it picked up this morning. The summary says how many likes happened inside the reporting window. On a post that keeps earning engagement after its first week, those two numbers should differ, and a dashboard that forces them to agree is lying to you in one place or the other.
We use the live counters as a fallback when per-media insights come back without like or comment values, rather than showing a zero. That is the right call for the card and the wrong call for a windowed report, which is why the weekly report is computed from windowed queries and not from the card values.
6. The response shape changed, and old code silently reads zero
A quieter one, for anyone building against this API rather than buying a tool.
In current versions, an account insights metric returns its number at total_value.value. Older versions returned it at values[0].value. Code written against the old shape does not throw when it meets the new one. It reads undefined, coerces, and renders 0.
That is the worst possible failure: a dashboard full of confident zeroes with no error anywhere, on an account that is performing fine. Our extractor checks the current shape, falls back to the legacy shape, and only then returns zero, so a shape change degrades into a stale-but-correct read instead of a silent wipe.
If you maintain your own reporting against Insights and your numbers went to zero without an error, check this before you check anything else.
What to check when your numbers do not match
- Compare like for like. The app's Insights and the API's windowed metrics use different ranges. Set both to the same explicit date range before concluding anything.
- Find out what your "impressions" column is actually requesting. If the tool still says Impressions anywhere, ask what metric backs it. After April 2025 the honest answer is
views, and it counts replays. - Check whether "Profile Views" is really
profile_links_taps. If the number is far lower than you expect, this is usually why. - Ask when your growth chart started recording. Any history before the day you connected the account does not exist and cannot exist.
- Check your follower count against 100 before assuming the demographics tab is broken.
- A whole dashboard of zeroes with no error message is a parsing failure, not a performance collapse. Reconnect the account, and if it persists it is the tool's bug.
Frequently asked questions
Why does my Instagram analytics tool show different numbers than the Instagram app?
The app reads Meta's internal data. Third-party tools read the public Insights API, which exposes a smaller, partly-deprecated metric set with different time windows. The most common causes are the impressions-to-views change, a relabelled profile-links metric, and the two sources being queried over different date ranges.
What happened to Instagram impressions?
Meta deprecated impressions and plays for v22.0, and for all versions from April 21, 2025. video_views went earlier, for v21.0 and all versions from January 8, 2025. The replacement for all three is views, which counts replays as well as first plays.
Are views and impressions the same thing?
No. Views includes replays of Reels and repeat displays of feed content. For looping content it runs materially higher than the old impressions number, so charts that span April 2025 have a definition change in the middle of them.
Why is my follower growth chart empty or short?
Because Instagram's API does not provide follower history. Every growth chart is built from daily snapshots the tool recorded itself, so it can only start from the day you connected the account.
Why can't I see my audience demographics?
Follower demographics require at least 100 followers, and engaged-audience demographics require at least 100 engagements in the timeframe. Meta's docs say the metric is simply "not returned" below those thresholds; in practice the API returns an error object, which is what tools have to handle.
Which number should I trust for reporting?
For anything spanning a date range, trust the windowed metrics and keep the range explicit. Live counters like a post's current like count are correct for "how is this post doing now" and wrong for "what happened last week".
Sources and references
Meta's own reference pages for the behaviour described above:
- Instagram User Insights: supported metrics,
metric_type,periodandbreakdownparameters, and the follower and engaged-audience demographic thresholds: developers.facebook.com - Instagram User Insights - Media insights and the per-media-type metric availability: developers.facebook.com - Instagram Media Insights
- The January 8 2025 deprecation of
video_viewsand the April 21 2025 deprecation ofimpressionsandplays, plus the October 2 2024 removal ofprofile_views,website_clicksandemail_contacts: developers.facebook.com - Instagram Platform changelog - The v22.0 deprecation notice and the introduction of
views: developers.facebook.com - Graph API changelog v22.0 - Socioverse: socioverse.io
Related reading: why scheduled Instagram reels fail to publish, how we engineer DM automation against Meta's rate limits, and AI content generation for Instagram.